
Page 94 - Modelisation du devenir des pesticides...
P. 94
Chapitre 3 Evaluation du modèle STICS version pesticide sur différents sites
expérimentaux
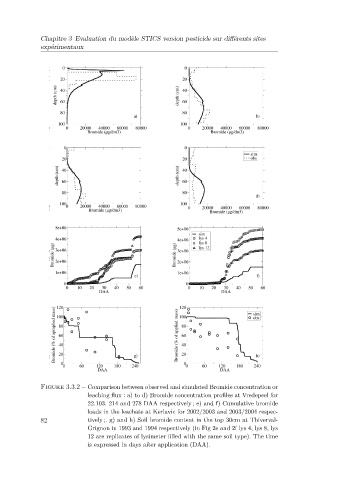
Figure 3.3.2 – Comparison between observed and simulated Bromide concentration or
leaching flux : a) to d) Bromide concentration profiles at Vredepeel for
22.103. 214 and 278 DAA respectively ; e) and f) Cumulative bromide
loads in the leachate at Kerlavic for 2002/2003 and 2003/2004 respec-
82 tively ;. g) and h) Soil bromide content in the top 30cm at Thiverval-
Grignon in 1993 and 1994 respectively (in Fig 2e and 2f lys 4, lys 8, lys
12 are replicates of lysimeter filled with the same soil type). The time
is expressed in days after application (DAA).