
Page 104 - Modelisation du devenir des pesticides...
P. 104
Chapitre 3 Evaluation du modèle STICS version pesticide sur différents sites
expérimentaux
!"#$%&#'(')*%*(& +(*,*#**-& .*(-'/01& 2(03"4"&
!"#$%#&'()*+,) -) ./) 0)
!"#$%#&12)*+,) /.) 33) .%4)
!"#$%#&51()*+,) .3) /3) /6)
=.
789#&'()*:);< ,) ..) 30) 46)
=.
789#&12)*:);< ,) .>0) /-.) $.3)
789#&51()*:);< ,) $$) .//) .%%)
=.
=.
=3
=-
?5@#1+A*)+ ,) .B.% )1(+).B.% ) %) %)
C8(AD1(D)EF)*G,) %B4-) /) #)
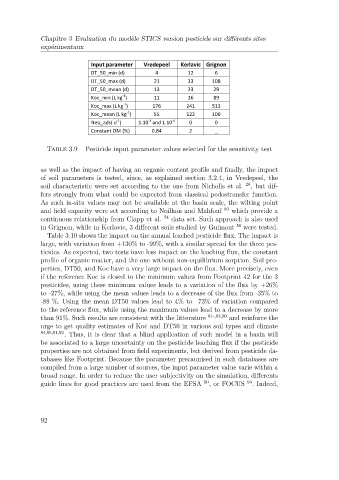
Table 3.9 – Pesticide input parameter values selected for the sensitivity test
as well as the impact of having an organic content profile and finally, the impact
of soil parameters is tested, since, as explained section 3.2.4, in Vredepeel, the
soil characteristic were set according to the one from Nicholls et al. 28 , but dif-
fers strongly from what could be expected from classical pedostransfer function.
As such in-situ values may not be available at the basin scale, the wilting point
and field capacity were set according to Noilhan and Mahfouf 89 which provide a
continuous relationship from Clapp et al. 74 data set. Such approach is also used
in Grignon, while in Kerlavic, 3 different soils studied by Guimont 56 were tested.
Table 3.10 shows the impact on the annual leached pesticide flux. The impact is
large, with variation from +130% to -99%, with a similar spread for the three pes-
ticides. As expected, two tests have less impact on the leaching flux, the constant
profile of organic matter, and the one without non-equilibrium sorption. Soil pro-
perties, DT50, and Koc have a very large impact on the flux. More precisely, even
if the reference Koc is closed to the minimum values from Footprint 42 for the 3
pesticides, using these minimum values leads to a variation of the flux by +26%
to -27%, while using the mean values leads to a decrease of the flux from -35% to
-88 %. Using the mean DT50 values lead to 4% to –73% of variation compared
to the reference flux, while using the maximum values lead to a decrease by more
than 91%. Such results are consistent with the litterature 81-,83,90 and reinforce the
urge to get quality estimates of Koc and DT50 in various soil types and climate
84,85,91,92 . Thus, it is clear that a blind application of such model in a basin will
be associated to a large uncertainty on the pesticide leaching flux if the pesticide
properties are not obtained from field experiments, but derived from pesticide da-
tabases like Footprint. Because the parameter precaunised in such databases are
compiled from a large number of sources, the input parameter value varie within a
broad range. In order to reduce the user subjectivity on the simulation, differents
guide lines for good practices are used from the EFSA 60 , or FOCUS 93 . Indeed,
92